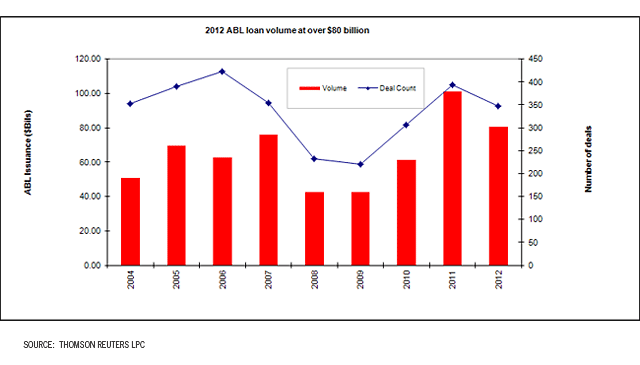
Asset-based lenders began 2012 rather downbeat. After all, at $101 billion, record 2011 syndicated ABL volume was going to be hard to measure up to, given limited M&A prospects and a maturity cliff that was largely addressed via a flood of opportunistic refinancings.
Nevertheless, with over $80 billion in annual dealflow, total 2012 ABL issuance, although down 20 percent compared to 2011 totals, represented the second-highest annual total on record.
“It’s hard not to think of this year as slow,” said one lender. “But really it is a more normalized year coming off such a high in 2011.”
From a deal count perspective, the pipeline was not off by as much; 347 deals worked their way through market in 2012, down from peak 2011 totals (394 financings), but outpacing annual deal counts between 2008 and 2010.

“Certainly the level of activity we are seeing isn’t unexpected,” said an arranger. “Last year, we saw so many deals that issuers would have done in 2009 and 2010, but they did not, due to price points. Last year we had repricings.”
By the end of 2011, the maturity cliff had been pushed out to 2016.
In 2012, the market saw a modest slowdown in refinancings (pushing the maturity cliff out a bit further into late 2017), and a corresponding pickup in event-driven transactions – especially at the smaller end of the market. Seventy-three percent of total lending represented refinancings, down from peak levels of 82 percent in 2011, but off from more normalized levels just north of 50 percent historically.
New asset-based loan volume came in under $22 billion. Although the proportion of new lending activity is up from the 18 percent observed in 2011 and on par with 2010 levels, it is a far cry from levels hovering near or even above 50 percent of total issuance between 2006 and 2008. More notably, issuers that did tap the market with new money credits showed a marked preference for smaller, clubbed lender groups at the expense of broader, retail syndications.
Unsurprisingly, this contributed to hefty lender competition and, in turn, some measure of structural deterioration of credit terms.
“ABL-like” credits emerged on the back of cash flow frothiness fueling a series of borrowing based transactions with little in the way of true ABL qualities. At the same time, lenders said issuers, and more specifically, private equity sponsors who tapped the market, successfully negotiated far more demands into deal structures. In addition to smaller lender groups, these demands included thinner spreads; the elimination of flex; and on select deals, a shift toward more agent discretion in the context of amendments.
“Sponsors are pretty active,” explained one lender. “There is a decent pipeline, but there has been a shift to covenant-lite revolvers.” Although this is a bull market phenomenon and does not typically last, “it is a negative driver for ABL right now.”
More significantly, in the scramble for assets, lenders not only struggled to secure new loans, but to also retain usage levels on booked assets.
“We have grown commitments [in 2012]”, said one lender. “But we are down on run rates because there are fewer outstandings.”
This was especially true in cases where the ABL loan was followed by a high yield bond, which was far more likely to soak up usage.
Amid an admittedly thin flow of event-driven transactions, 2012 ABL M&A volume totaled $6.3 billion. Of this total, over 60 percent represented financings that backed sponsored takeovers. More significantly, given the clubbed nature of many of these transactions, lenders noted that individual deals had limited relevance as comparables when it came to structuring the next credit. A financing effectively “became a comp for a clubbed sponsored deal,” said one lender, “but not necessarily for the broader market.”

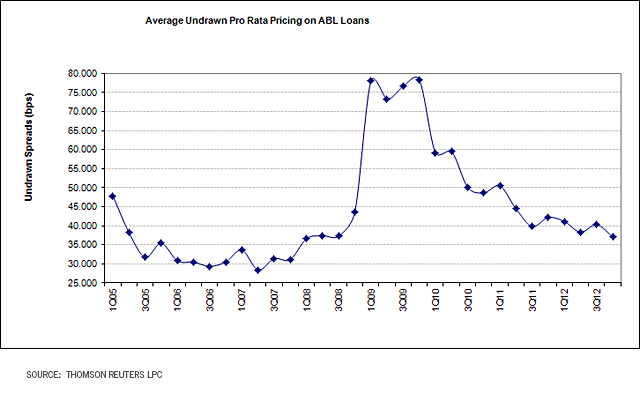
In this context, average drawn spreads saw slow but real erosion in 2012, settling at about LIB+223 by year end. In practice, however, lenders noted that good quality credits were pitched well south of that in the range of 175bp (or even 150bp) to 200bp.