"War is ninety percent information." -- Napoleon Bonaparte, French Military and Political Leader
One of the challenges for asset-based lenders is predicting what sectors are experiencing financial distress and under what conditions it may arise. Understanding whether distress is increasing in a particular sector may influence a company’s decision to get involved in that sector, or diligence may reveal that some red flags are more “red” than others. There are existing analyses in the market that either attempt to divine the extent of potential distress based on the trading of bonds or other securities (but they are limited to larger companies with publicly available price information and result in speculation on what might happen next) or use raw bankruptcy filing numbers and declare that filings are up or down without distinguishing what filings matter to parties evaluating credits and opportunities.
Curious about the answers to these questions, members of Polsinelli P.C. developed the Polsinelli/TrBk Distress Indices, which are published quarterly and can be found here. The indices compile and analyze all Chapter 9 and 11 business filings with assets of over $1 million from 2010 to present. The indices exclude all Chapter 7, 12 and 13 cases, as well as Chapter 11 cases with de minimis assets. They do not discriminate between public or private companies, but instead capture all types of companies from “Main Street” to “Wall Street.” The data for the indices is supplied exclusively by information provider TrollerBK.com.
There are three indices: the Chapter 11 Distress Research Index, the Real Estate Distress Research Index, and the Healthcare Services Distress Research Index. The Real Estate and Healthcare Indices are sub-indices of the Chapter 11 Index. Each index has a baseline of the fourth quarter of 2010 (just after the Great Recession) and is calculated on a rolling four-quarter basis to smooth out quarterly spikes in filings. The rolling four-quarter average provides a better picture of long-term trends. The indices are contrarian indicators of economic health in the U.S. economy, i.e. an increasing index means less financial stability and more distress.
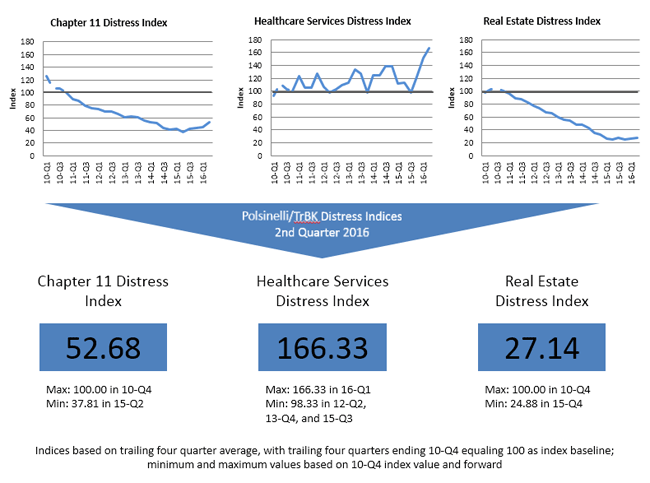
In the second quarter of 2016, all three indices increased simultaneously. This is second consecutive quarter that this has happened, and these two most recent quarters are the only times that all three indices have increased together since 2010. Generally speaking, the Chapter 11 Research Index has been steadily increasing over the last few quarters, the Real Estate Distress Research Index has remained relatively stable with a slight uptick, and the Healthcare Services Distress Research Index has increased significantly over the last several quarters.

Results of Healthcare Services Distress Research Index
The Healthcare Services Distress Research Index, in particular, is the highest it has been since 2010, eclipsing the previous high from last quarter. In the second quarter of 2016, the Index was 166.33, 66% higher than the benchmark period of 2010, and an increase of 8% from the first quarter of 2016. For perspective, the Chapter 11 Distress Research Index was 52.68 for the second quarter of 2016 and the Real Estate Distress Research Index was 27.14.
Healthcare services filings in the second quarter of 2016 constituted 3.50% of overall chapter 11 filings, which has been consistent with recent performance and a substantial increase over the benchmark period of the fourth quarter of 2010.
Historically, the general distress and distressed real estate indices have tracked each other fairly consistently, with both indices rising and falling during the same time periods. The Healthcare Services Distress Research Index has deviated significantly from the other two, suggesting that the healthcare services sector is decoupled from the U.S. economy as a whole and is subject to its own sector-based economic pressures.
The Causes of Healthcare Distress
The healthcare sector is by any measure a massive economic driver, constituting nearly $3.2 trillion in overall spending in the U.S. economy. Healthcare spending is projected to constitute nearly 20% of the U.S. economy by 2021.
It is indisputable that the healthcare industry has been experiencing enormous consolidation over the past several years, especially for hospitals and insurance companies. Consolidation in any industry is a primary cause of distress: orphaned companies may find it difficult to compete against larger companies, acquisitions may be more costly than anticipated, or mergers may fail to achieve projected synergies and can drag down overall performance. In healthcare, fraud and abuse can give rise to crippling liabilities or reimbursement rate changes can radically alter business plans.
In addition to these long-standing risks in healthcare, the implementation of the Affordable Care Act (ACA) is the biggest change in the healthcare market since the Great Society Programs of the 1960s. The ACA is incredibly complex and regulations and means of implementation are still unfolding, and it is difficult to determine when the uncertainties will resolve.
Continued on Page 2...